Monday, October 31, 2016

chart: Buying Pressure


Buying pressure at the close today made a recent low as indicated in the red circle.  The yellow lines are areas of previous lows and the red lines are subsequent price movements.
Usually the buying pressure displays positive and negative divergences.
We do not have a positive divergence setup yet.

Keep following JustSignals using Twitter, @StockTwits or Follow By Email. 
Just submit your email address in the box on the Blog homepage
This has been posted for Educational Purposes Only.   Do your own work and consult with Professionals before making any investment decisions.  
Past performance is not indicative of future results

charts: Earl & Earl2 and stocks after the election

By Danny of LunaticTrader.com

Stocks came under some pressure last week and the S&P 500 is struggling to say above the important 2120 support level. As we pointed out last week, price action has been weak and there is nothing going on as long as there is no clear breakout, up or down. We are still in that situation but now my indicators are starting to turn down, suggesting that a breakout to the downside is gradually becoming the more likely scenario. Here is the current Nasdaq chart:
comp-daily-2_5_2015-10_28_2016
Earl and MoM indicators have turned down after a very weak rally attempt and the slower Earl2 is languishing at low levels, apparently unable to get back above the zero line. The lunar green period will be ending later his week and it looks like we will be lucky if it ends near breakeven for the period. This suggests the path of least resistance is down.
Looking at the LT wave chart for November offers more reason for caution:
ltwavenov2016
We got the expected weakness in the first half of October, but the positive bias after the 15th was very weak. Most of the peak LT wave values happened to come on weekend days when markets are closed, but the other days didn't produce any convincing green candles either.
Going into November the wave tries to hold up in the first days, but then shows a drop with weakness to continue until around the 17th. The rest of the month is hardly above neutral. The lowest LT wave value for the month comes on the 10th, and the high is projected for the 19th.
Does this mean the market will crash? No. Does this have anything to do with the upcoming US election? No. Four years ago when Obama was re-elected the S&P 500 dropped 6% in the next two weeks. I guess that whoever wins the election, some half of the population will be disappointed and may see it as a good reason to sell stocks. Everything is possible and there is no guarantee whatsoever that the projected LT wave pattern will pan out.
Keep following JustSignals using Twitter, @StockTwits or Follow By Email. 
Just submit your email address in the box on the Blog homepage
This has been posted for Educational Purposes Only.   Do your own work and consult with Professionals before making any investment decisions.  
Past performance is not indicative of future results

Sunday, October 30, 2016

chart: % stks above 40DMA

Courtesy of Worden Bros.
Looks like a breakout to the upside out of this triangle "may" be coming.
Watch out for any head fakes to the downside before turning up.

Keep following JustSignals using Twitter, @StockTwits or Follow By Email. 
Just submit your email address in the box on the Blog homepage
This has been posted for Educational Purposes Only.   Do your own work and consult with Professionals before making any investment decisions.  
Past performance is not indicative of future results

Friday, October 28, 2016

chart: Next 5 Days, Strong on heat map

Originally posted on Twitter on Oct 27,2016

Keep following JustSignals using Twitter, @StockTwits or Follow By Email. 
Just submit your email address in the box on the Blog homepage
This has been posted for Educational Purposes Only.   Do your own work and consult with Professionals before making any investment decisions.  
Past performance is not indicative of future results

Wednesday, October 26, 2016

chart: Harry Dent's Spending Wave


The above chart was updated in 2013.
In general the shape of the red spending wave and the blue line of the DJIA (adjusted for inflation) share a very common shape.  The yellow areas highlight common highs and lows.  The two black vertical lines display the 2016-17 forecast high and the 2020-22 forecast low.  What is very interesting is that JustSignals LT cycles are calling for similar highs and lows.  Rough times just ahead is a very good possibility, unfortunately.

Keep following JustSignals using Twitter, @StockTwits or Follow By Email. 
Just submit your email address in the box on the Blog homepage
This has been posted for Educational Purposes Only.   Do your own work and consult with Professionals before making any investment decisions.  
Past performance is not indicative of future results

Tuesday, October 25, 2016

charts: Dow Theory divergence

By Wikipedia

Stock market averages must confirm each other
In Dow's time, the US was a growing industrial power. The US had population centers but factories were scattered throughout the country. Factories had to ship their goods to market, usually by rail. Dow's first stock averages were an index of industrial (manufacturing) companies and rail companies. To Dow, a bull market in industrials could not occur unless the railway average rallied as well, usually first. According to this logic, if manufacturers' profits are rising, it follows that they are producing more. If they produce more, then they have to ship more goods to consumers. Hence, if an investor is looking for signs of health in manufacturers, he or she should look at the performance of the companies that ship their output to market, the railroads. The two averages should be moving in the same direction. When the performance of the averages diverge, it is a warning that change is in the air.
 
Courtesy of Worden Bros.
 Keep following JustSignals using Twitter, @StockTwits or Follow By Email. 
Just submit your email address in the box on the Blog homepage
This has been posted for Educational Purposes Only.   Do your own work and consult with Professionals before making any investment decisions.  
Past performance is not indicative of future results


Sy Harding's STS

Excerpts from "Beat the Market the Easy Way" by Sy Harding

"Sell in May and Go Away"
"Ned Davis Research Inc. published numerous studies showing the positive  historical results of being invested in the markets for the seven month period of October 1 to May 1, and being in cash the other five months."
"Thus an investor standing aside during the market's infavorable seasons not only matched the buy and hold performance of the S&P 500 and did so with only 50% of market risk, but also avoided the emotional stress  of seeing portfolios often plunge precipitously during unfavorable seasons."

  "IT IS NOT A FIXED 6-MONTHS IN, 6-MONTHS OUT!"

It is BEST to read this book.  The book is available at many libraries, either in paper or digital versions or it can be purchased easily online.

In summary, after the research made by Ned Davis Research Inc., Yale Hirsch of the Hirsch Organization and Alan Newman, editor of the Crosscurrents newsletter, Sy Harding's firm, Asset Management Research Corp. conducted more detailed research.  In their research they found that when the Moving Average Convergence Divergence (MACD), developed by Gerald Appel, was applied, the performance was much better.
"It works this way in our (Sy Harding's) seasonal strategy."
"If MACD is on a technical buy signal, indicating a rally is underway, when the October 16 earliest calendar date for seasonal entry arrives, we will enter at that time."
"However, if the MACD indicator is on a sell signal when the October 16 calendar date arrives, indicating a market decline is underway it would not make sense to enter before that decline ends, even though the average best calendar entry date has arrived.  In that event, our (Sy Harding's) Seasonal Timing Strategy simply waits to enter until MACD gives it's next buy signal, indicting that the decline has ended."
Use the same method in reverse when April 20 arrives to better pinpoint the end of the markets favorable period in the Spring.

Please take the time to read Sy Harding's book.  It is relatively short and easy to read and it has many more exciting findings by Sy Harding.
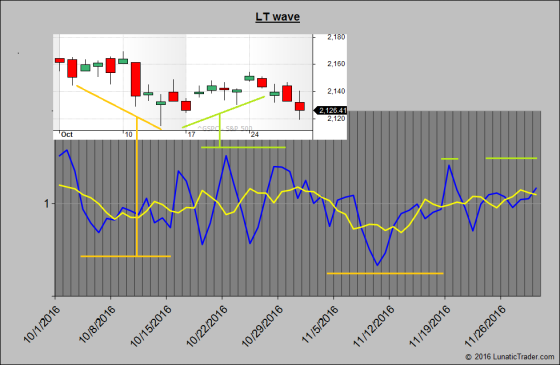
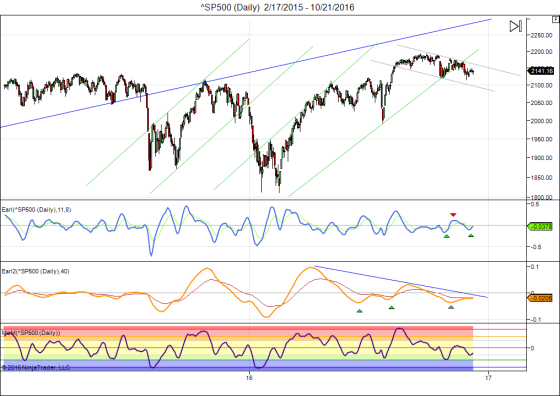
Courtesy of Worden Bros. Oct 25,2016
Keep following JustSignals using Twitter, @StockTwits or Follow By Email. 
Just submit your email address in the box on the Blog homepage
This has been posted for Educational Purposes Only.   Do your own work and consult with Professionals before making any investment decisions.  
Past performance is not indicative of future results

Monday, October 24, 2016

Earl & Earl2

By Danny of LunaticTrader.com

The S&P 500 is more or less where it was in mid July, and except for a few volatile days in early September the market has hardly moved.
Some people will blame it on the upcoming elections, but this kind of go-nowhere periods also happen when there are no elections. One thing is clear: this too will pass, we just don't know when.
Let's have a look at the current S&P chart:
sp500-daily-2_17_2015-10_21_2016
Stocks appear to be trying the upside again after holding the important 2120 support. But it is not a convincing rally attempt so far.
The S&P is in a mild down trend channel (grey lines) and how it emerges from it is likely to decide on the next major move. All we can do is wait.
 Keep following JustSignals using Twitter, @StockTwits or Follow By Email. Just submit your email address in the box on the Blog homepageThis has been posted for Educational Purposes Only.   Do your own work and consult with Professionals before making any investment decisions.  Past performance is not indicative of future results

Wednesday, October 12, 2016

29 Year Cycle


1929 crash, October 1929
+29
=1958  Eisenhower recession
+29
=1987 crash, October 1987
+29
=2016 ?

Keep following JustSignals using Twitter, @StockTwits or Follow By Email. Just submit your email address in the box on the Blog homepageThis has been posted for Educational Purposes Only.   Do your own work and consult with Professionals before making any investment decisions.  Past performance is not indicative of future results

Monday, October 10, 2016

Picasso Cycle Dates

The following was posted on September 25,2016.
The Picasso Cycle Dates have been working very well recently.
The next group of Picasso Cycle Dates will be posted shortly.

In this update only the dates will be mentioned with an "H" for high and a "L" for low.
The chart amplitude can and will be misleading at times.
In addition, it is the date that is most important rather than if that date is a projected high or low with amplitude as sometimes shown on the chart.
One important reason is because in some cases a date may invert and the amplitude and the "H" or "L" may not mean anything.
A low may actually turn out to be a high and visa versa.
Also it is very important that other tools always be used to confirm any potential ST Cycle Date.

Picasso Dates, always +/-
8/31-9/3* H
9/17 L
9/20-26 H
10/5-9 L
10/17-18 H

* Note that 9/3 is an Anniversary Date of the 1929 high on 9/3/1929


Keep following JustSignals using Twitter, @StockTwits or Follow By Email. Just submit your email address in the box on the Blog homepageThis has been posted for Educational Purposes Only.   Do your own work and consult with Professionals before making any investment decisions.  Past performance is not indicative of future results

Best 6 months & MACD

Best 6 months and MACD
 
05-06-2014, 10:43 AM | Post #3539907
See how it works below.

To see when to sell look here

April 20 had MACD at a buy signal, you need to wait for the next sell signal. Looking at the chart...it's today.
==========================
As you are probably already aware, after decades of historical research, we discovered that most of the market’s gains occur during the months November through April. An analysis of the average gains for each month shows that November, December, January, March and April have been outstanding months since 1950. Add February and our “Best Six Months” strategy is born.
Market timer Sy Harding, in his book, Riding The Bear, took our November-through-April strategy, enhanced it, and termed it the “Best mechanical system ever.” He simply used the MACD indicator developed by our old friend Gerald Appel to enter the “Best Six Months” period up to several weeks earlier, if the market was in an uptrend. Conversely, Harding would exit up to several weeks later as long as the market kept moving up.
The key here is using the MACD indicator in conjunction with other tools like our “Best Six Months” strategy to confirm or assist in timing, buy and sell decisions. So once we enter April or October we begin tracking MACD.

This is what Sy Harding says:

http://www.streetsmartreport.com/sts.html
We discovered that those best days on average are October 16 for the entry into the market for its favorable seasonal period, and April 20 for the exit from the market’s favorable season. However, those are just the best days as averaged over a very long time period.Obviously the market does not begin a rally on the same day each year, or begin to decline from a top on the same day each year. And recognition of that obvious fact is the most important aspect of our strategy.
So we then concentrated on determining a means by which the entries and exits could be more accurately pinpointed for each individual year.
The result was our Seasonal Timing Strategy, or STS.
Since the market does not begin or end its positive period on the same day each year, we combined the market’s best average calendar entry and exit day with a technical indicator, the Moving Average Convergence Divergence indicator, or MACD. It is a short-term momentum-reversal indicator developed by Gerald Appel in the 1980s, designed to signal when the market has begun either a short-term rally, or a short-term correction. 
The idea is that if a rally is underway when the October 16 calendar date for seasonal entry arrives, as indicated by the MACD indicator, we will enter at that time. However,if the MACD indicator is on a sell signal when the October 16 calendar date arrives, indicating a market decline is underway, it would not make sense to enter before that decline ends, even though the best average calendar entry date has arrived. Instead, our Seasonal Timing Strategy simply waits to enter until MACD gives its next buy signal, indicating that the decline has ended.
We use the same method to better pinpoint the end of the market’s favorable period in the spring. If MACD is on a sell signal when the calendar exit day of April 20 arrives, we exit at that point. However,if the technical indicator is on a buy signal, indicating the market is in a rally when April 20 arrives, it makes no sense to exit the market just because the calendar date has arrived. So our Seasonal Timing Strategy’s ‘exit rule’ is to simply remain in the market until MACD triggers its next sell signal indicating the rally has ended.


http://www.stocktradersalmanac.com/sta/research_tool_MACDEntryExitDOW.jsp

Keep following JustSignals using Twitter, @StockTwits or Follow By Email. Just submit your email address in the box on the Blog homepageThis has been posted for Educational Purposes Only.   Do your own work and consult with Professionals before making any investment decisions.  Past performance is not indicative of future results