Monday, November 30, 2015

First Day Gains

A re post from October 28,2015
Tomorrow is Tuesday December 1,2015

DJIA gains more on first day than all other days

Over the last 15 1/4 years the Dow Jones Industrial Average has gained more points on the first trading days of all months than all other days combined. While the Dow has gained 5481.72 points between September 2, 1997 (7622.42) and December 31, 2012 (13104.14), 5323.19 points were gained on the first trading days of these 184 months. The remaining 3674 trading days combined gained just 158.53 points during the period. This averages out to gains of 28.93 points on first days, in contrast to only 0.04 points on all others. See Table 1.
Note that September 1997 through October 2000 racked up a total gain of 2632.39 Dow points on the first trading days of these 38 months (winners except for seven occasions). But between November 2000 and September 2002, when the 2000-2002 bear markets did the bulk of their damage, frightened investors switched from pouring money into the market on that day to pulling it out in fourteen months out of twenty-three. This netted a 404.80 Dow point loss. The 2007-2009 bear market lopped off 964.14 Dow points on first days in 17 months from November 2007 to March 2009. First days had their worst year in 2011, declining seven times for a total loss of 644.45 Dow points.
First days of June have performed worst. Triple digit declines in four of the last five years have resulted in the worst net loss. August is the second net loser. In rising market trends, first days perform much better as institutions are likely anticipating strong performance at each month’s outset. S&P 500 first days track the Dow’s pattern closely but NASDAQ first days are not as strong with weakness in April, August, and October.

Courtesy of Jeffrey A. Hirsch
 For more information contact
 JEFFREY A. HIRSCH, editor-in-chief of the Stock Trader's Almanac and Almanac Investor newsletter, and the author of The Little Book of Stock Market Cycles (Wiley, 2012).
 www.stocktradersalmanac.com

Keep following JustSignals using Twitter, @StockTwits or Follow By Email. 
Just submit your email address in the box on the Blog homepage
This has been posted for Educational Purposes Only.   Do your own work and consult with Professionals before making any investment decisions.  
Past performance is not indicative of future results

Milton Berg on Commodities

Milton Berg on Commodities

Click on this link for the BloombergTV interview 

http://bloom.bg/1XsucEb


Keep following JustSignals using Twitter, @StockTwits or Follow By Email.  
Just submit your email address in the box on the Blog homepage
This has been posted for Educational Purposes Only.   Do your own work and consult with Professionals before making any investment decisions. 
Past performance is not indicative of future results

Short & Intermediate Term Cycles Update

The following was posted on November 9,2015
Today's comments are in Blue

Short term details:(every date is +/-)
Nov 2nd high     A high was made on Nov 3rd.  (note the dates are +/-)  As of today Nov 3rd was the high
Nov 4-6 some kind of consolidation or a bias up into Nov 6     We are still in the Nov 4-6 window, but, it does look like we had a classic turn around day this morning.  The market drifted higher to DJIA + 42 and is currently DJIA -76. The suggested consolidation is what we had with an attempt on Nov 5th to rally up to the Nov 3rd high, as described above, but that attempt failed.
Nov 9th low   As of the time of this writing, the DJIA is down -220.44 and the cycles suggested a low for today.
Nov 12th high  SPY High was on Nov 11th
Nov 17th low   SPY Low was on Nov 16th
Nov 22nd high  SPY high was on Friday Nov 20th
Dec 5th low  This low date has expanded now to Dec 5-7
 
The short term and intermediate term cycles are suggesting a bottom sometime in late November to early December.   These dates have now extended slightly into December.  Short term cycles suggest some volatility from Dec 5-7th to Dec 24th.   The cycles suggest several dates to watch for possible turns.  They are Dec 9, 11, 13, 14, 16-19 and the 24th.   Of course these dates are +/-.  
From Dec 24th the cycles have an upward bias into January 7-14.
 
Intermediate term cycles suggest a bias to the upside into the early to mid part of 1Q2016.  Then a correction into the mid to late part of 2Q2016. 
 
More on both the short term and intermediate term cycles as we get through some of these dates...
 
Keep following JustSignals using Twitter, @StockTwits or Follow By Email. 
Just submit your email address in the box on the Blog homepage
This has been posted for Educational Purposes Only.   Do your own work and consult with Professionals before making any investment decisions.  
Past performance is not indicative of future results

Tuesday, November 17, 2015

chart: May S&P Sets All Time High

When the May S&P Sets an All Time High
By Wayne Whaley
May 13, 2014

Since 1950, the S&P is 46-18 over the seven month June-December time frame for an average/median gain of 4.54/5.88%. On May 12, 2014, the S&P closed at an all time high of 1896.65. In those 20, post 1949, years in which an all time high was set during the month of May, the last seven months of those calendar years has done much better than the norm, going 17-3 for an average/median return of 8.09/8.04% Eight of those 20 years had +10% June-December while a double digit loss has never occurred in the seven months following an all time May High.
Courtesy of Wayne Whaley
Based on the above findings of Wayne Whaley through 2013, let's try and see how this data might be able to help us in 2015.
1) All of the years are when there was an All Time High in May

So what is different this year? An August sell off and a big October rally.  Then let's look and see what years come closest to a May All Time High, an August sell off and a big October rally. 

2) There are two years that are close to an August sell off.  1986 & 1990
3) Big October rallies. 1985, 1986, 1999 & 2013
4) Which year noted in #3 and #4 above comes closest to the events in 2015 ?
1986 seems to come closest.  If you were to pick 1990 because of the August sell off instead of the September sell off in 1986, the balance of the year was still off -8.58%.

The other two years, 1999 & 2013, although they did well for the balance of the year, they were not picked because they did not have a material sell off in August & September or June & July either.

2014 - What happened for the balance of this year?
1) May All Time High
2) 2014 had both an October correction in the first half of the month and a big rally in the second half of the month that allowed October to close with a small gain.
3) The stock market did not gain much traction between Oct 31st and Dec 31st  with some similarities to the second half of 2015.   2014 did pick up approx 8% from May 12,2014 to December 31,2014.

Conclusion:
Today is Nov 17,2015.  What might happen between today and the end of the year?   So far Nov 2015 has a small loss to date.   
Scenario #1 - If we pick a year in the chart above that most resembles the May, Aug/Sept & Oct periods in 2015, that year is 1986.  Going forward the total of Nov & Dec in 1986 was flat.   
Scenario #2 - The short term cycles suggested a low today and instead the low occurred with the pre market futures yesterday morning.  Going forward the cycles suggest a, high 11/22+/-, low 12/5+/-, then some backing and filling in Dec with a bias up into year end.

So both of these scenarios do not suggest a big year end rally, unless there is a scenario #3 of course.

NOTE - The DJIA & the S&P500 are both  currently lower than their May 2015 highs.  See the chart above, this also happened in 1986, -2,09% from June - December 1986.

Keep following JustSignals using Twitter, @StockTwits or Follow By Email.  
Just submit your email address in the box on the Blog homepage
This has been posted for Educational Purposes Only.   Do your own work and consult with Professionals before making any investment decisions. 
Past performance is not indicative of future results


Monday, November 16, 2015

chart: SPX 90min


Keep following JustSignals using Twitter, @StockTwits or Follow By Email.  
Just submit your email address in the box on the Blog homepage
This has been posted for Educational Purposes Only.   Do your own work and consult with Professionals before making any investment decisions. 
Past performance is not indicative of future results

chart: % of DJIA Stocks above 10DMA

Courtesy of IndexIndicators.com
Some kind of a bounce will try to work off this oversold condition.   The short term cycles are suggesting a low on 11/17/15 +/-.    Click on this link for the full explanation  
http://justsignals.blogspot.com/2015/11/short-intermediate-term-cycles.html


Keep following JustSignals using Twitter, @StockTwits or Follow By Email.  
Just submit your email address in the box on the Blog homepage
This has been posted for Educational Purposes Only.   Do your own work and consult with Professionals before making any investment decisions. 
Past performance is not indicative of future results

chart: Nasdaq

Courtesy of @LunaticTrader
All my indicators point down and have further to fall before we can start looking for a tradeable bottom. Especially the slower Earl2 (orange line) is still very high. So I would just wait and see until the setup looks more favorable. A further drop to 4800 is not out of the question.
Could it go lower and fall below the August lows? Everything is possible, but I don't think this market has topped out already. I didn't see the kind of public enthusiasm and participation that normally marks major peaks.
 By  Danny  @LunaticTrader
 Keep following JustSignals using Twitter, @StockTwits or Follow By Email.  
Just submit your email address in the box on the Blog homepage
This has been posted for Educational Purposes Only.   Do your own work and consult with Professionals before making any investment decisions. 
Past performance is not indicative of future results
 

chart: Swing Trade Signal

Courtesy of StockCharts.com
The chart above in displays several swing trade sell signals including the recent one generated last week.   Two failures were circled in red.  Stops are always recommended.

Keep following JustSignals using Twitter, @StockTwits or Follow By Email.  
Just submit your email address in the box on the Blog homepage
This has been posted for Educational Purposes Only.   Do your own work and consult with Professionals before making any investment decisions. 
Past performance is not indicative of future results

Major Sell Signal Update

On September 4,2015 a Major Sell Signal was generated and posted, see at this link:  
http://bit.ly/1UxbR21

In the Sept 4,2015 posting, there were charts of the passed two sell signals.
One on Nov 27,2000 and the other one on March 31,2008.


Another indicator was found buried in the archives.  The indicator had  a few past sell signal dates and they were, Jan 1974, Jan 2001 & Jan 2008.   These dates are very close to the dates posted on Sept 4, 2015.
Nov 27,2000 compared to Jan 2001 and
March 31,2008 compared to Jan 2008

Two different types of indicators generated sell signals that called 3 bear markets and confirmed the current past two bear markets.  The data posted on Sept 4,2015 unfortunately did not go back to 1974 to make a comparison of both signals, but, the Jan 1974 sell signal was a very good one on it's own.  The S&P 500 continued it's selloff.

The new indicator was updated and found another sell signal on Jan 2015.  This confirms the sell signal of Sept 4,2015 and the evidence keeps mounting.  Either the market topped already or we are very close to a top.  The caution light is on.

At this point daily sell signals should be taken seriously, but, with the proper stops in place in case that market does rally and it makes a marginal new high. 

If history is going to teach us, the sell signal in 2000 generated some buy and sell signals on the daily charts while the sell signal in 2008 did not.  

Go back and review your charts and see the differences for yourself.

Keep following JustSignals using Twitter, @StockTwits or Follow By Email.  
Just submit your email address in the box on the Blog homepage
This has been posted for Educational Purposes Only.   Do your own work and consult with Professionals before making any investment decisions.  
Past performance is not indicative of future results

Thursday, November 12, 2015

chart: SPY daily

Courtesy of StockCharts.com
This chart of SPY as of the close of Nov 11,2015 does not look good.  As of 9:26am this morning the DJIA futures are down -125.00 points.  The cycles high forecast for Nov 12th +/- right now looks like it occurred in the middle of yesterdays trading when we had a failed rally.

Keep following JustSignals using Twitter, @StockTwits or Follow By Email.  
Just submit your email address in the box on the Blog homepage

This has been posted for Educational Purposes Only.   
Do your own work and consult with Professionals before making any investment decisions.  
Past performance is not indicative of future results

Wednesday, November 11, 2015

SPY & TD REI

Weekly SPY with the TD REI below

Weekly SPY
Red bars - OB sell signals
Green bar - OB sell signal failure
Yellow bar - ???

The Description
The DeMark Range Expansion Index is a market-timing oscillator described in DeMark on Day Trading Options, by T.R. DeMark and T.R. Demark, Jr., McGraw Hill, 1999. The oscillator is arithmetically calculated and is designed to overcome problems with exponentially calculated oscillators, like MACD. The TD REI oscillator typically produces values of -100 to +100 with 45 or higher indicating overbought conditions and -45 or lower indicating oversold. DeMark advises against trading in extreme overbought or oversold conditions indicated by six or more bars above or below the 45 thresholds. For more information on using TD REI the user is referred to the DeMark text.

Keep following JustSignals using Twitter, @StockTwits or Follow By Email.  
Just submit your email address in the box on the Blog homepage
This has been posted for Educational Purposes Only.   Do your own work and consult with Professionals before making any investment decisions.  
Past performance is not indicative of future results

chart: UUP

Courtesy of ChaikinAnalytics.com
Keep following JustSignals using Twitter, @StockTwits or Follow By Email.  
Just submit your email address in the box on the Blog homepage
This has been posted for Educational Purposes Only.   Do your own work and consult with Professionals before making any investment decisions.  

Past performance is not indicative of future results

chart: VIX

Coutesy of eSignal

Keep following JustSignals using Twitter, @StockTwits or Follow By Email.  
Just submit your email address in the box on the Blog homepage
This has been posted for Educational Purposes Only.   Do your own work and consult with Professionals before making any investment decisions.  
Past performance is not indicative of future results

Monday, November 9, 2015

chart: Pullback Time

By Danny @LunaticTrader
Markets are trying to catch their breath after the strong run in October. We may see another rally attempt this week, but I think we are going to get more of a pullback before stocks go higher again next year. With many indexes near their all time highs again a lot of investors will probably take some profits.
Let's have a look at the S&P 500 (click image to enlarge it):

Courtesy of @LunaticTrader
The S&P is bumping into overhead resistance in the 2100-2130 area. Technically the the fast Earl (blue line) is showing a bearish divergence while the slower Earl2 (orange line) is finally flattening out at a very high level. This is the kind of setup that normally starts a pullback of 4 to 6 weeks.
So, if stocks try to climb again this week it will be a chance to take some profits. Next week we will start a new lunar red period and I think the S&P will use it to retest the 2050 level.
Good luck,
Danny

Keep following JustSignals using Twitter, @StockTwits or Follow By Email.  
Just submit your email address in the box on the Blog homepage
This has been posted for Educational Purposes Only.   Do your own work and consult with Professionals before making any investment decisions.  
Past performance is not indicative of future results

chart: Short Term Signals

Courtesy of TradeStation
1) Sell signals - Red vertical bars
2) Confirmation when #1 plus the white MA is below the fuchsia MA
3) Additional confirmation when #1 & #2 plus the price bars are below the blue MA

4) Buy signals - Green vertical bars
5) Confirmation when #4 plus the white MA is above the fuchsia MA
6) Additional confirmation when #4 & #5 plus the price bars are above the blue MA

Keep following JustSignals using Twitter, @StockTwits or Follow By Email. 
Just submit your email address in the box on the Blog homepage
This has been posted for Educational Purposes Only.   Do your own work and consult with Professionals before making any investment decisions.  
Past performance is not indicative of future results


Short & Intermediate Term Cycles Update

The following was posted on November 5,2015
Today's comments are in Blue

Short term details:(every date is +/-)
Nov 2nd high     A high was made on Nov 3rd.  (note the dates are +/-)  As of today Nov 3rd was the high
Nov 4-6 some kind of consolidation or a bias up into Nov 6     We are still in the Nov 4-6 window, but, it does look like we had a classic turn around day this morning.  The market drifted higher to DJIA + 42 and is currently DJIA -76. The suggested consolidation is what we had with an attempt on Nov 5th to rally up to the Nov 3rd high, as described above, but that attempt failed.
Nov 9th low   As of the time of this writing, the DJIA is down -220.44 and the cycles suggested a low for today.
Nov 12th high
Nov 17th low 
Nov 22nd high
Dec 5th low
The short term and intermediate term cycles are suggesting a bottom sometime in late November to early December.  From there a bias to the upside into the early part of 1Q2016.  Then a correction into the late part of 2Q2016. 
More on both the short term and intermediate term cycles as we get through some of these dates...
Keep following JustSignals using Twitter, @StockTwits or Follow By Email. 
Just submit your email address in the box on the Blog homepage
This has been posted for Educational Purposes Only.   Do your own work and consult with Professionals before making any investment decisions.  
Past performance is not indicative of future results

Friday, November 6, 2015

chart: SPY monthly

Courtesy of eSignal
The current month's price bar is up against a trend line that was support since 2011.  This trend line has been touched several times and it has held the trend and has become a meaningful support line.  Support trend lines turn into resistance trend lines.  It will be very interesting to see if the trend line becomes major resistance now that trading is below it.  The loss of momentum in the bottom window and the long term sell signal in the middle window indicate the "possibility" of continued weakness. 

Keep following JustSignals using Twitter, @StockTwits or Follow By Email. 
Just submit your email address in the box on the Blog homepage
This has been posted for Educational Purposes Only.   Do your own work and consult with Professionals before making any investment decisions.  
Past performance is not indicative of future results

Nasdaq chart By Tom McClellan

Courtesy of McClellan Financial Publications
November 05, 2015
By Tom McClellan 

The stock market rebound which started from the Sep. 29, 2015 low has been a lot more robust than a lot of people expected (including me).  The big-cap Nasdaq-listed tech stocks have led the way, interestingly leaving behind the smaller cap stocks that comprise most of the Nasdaq list. 
Because the Nasdaq Composite Index ($COMPQ) is capitalization-weighted, those bigger companies have much more of an influence on driving the value of the index.  Their gains have pushed it up close to a new all-time high; the Nasdaq 100 Index which is made up only of the biggest 100 non-financial stocks on the Nasdaq has already made it to a higher high.  
The point in this week’s chart is that the Nasdaq’s gains may well be a case of going too far too fast.  The indicator in the chart is a very simple one, measuring the percentage change from the index value 21 trading days before.  This same indicator is sometimes referred to as “rate of change” (ROC), or “momentum”.  You can see your own copy of this chart at this link
When this indicator goes up above around +8%, it signals a short term blowoff up move which merits a giveback of some sort.  That giveback process does not have to commence right away just because of this indicator getting to an overbought level, but pullbacks do pretty reliably arrive after such readings. 
The current instance is all the more interesting because it appears just as the Nasdaq Comp is returning to the underside of its broken uptrend line.  Testing a broken trendline is a normal event following a breaking of the line, and so the overbought 21-day percent change reading makes the argument that it will be very difficult right at the moment for the Nasdaq Comp to climb back up on top of that line. 
Tom McClellan
Editor, The McClellan Market Report
www.mcoscillator.com
(253) 581-4889

Keep following JustSignals using Twitter, @StockTwits or Follow By Email. 
Just submit your email address in the box on the Blog homepage
This has been posted for Educational Purposes Only.   Do your own work and consult with Professionals before making any investment decisions.  
Past performance is not indicative of future results

chart: DJ Utilities

Courtesy of eSignal
The DJU are down 21.09 3.64% as of Friday Nov 6,2015 at 10:10am.  

Keep following JustSignals using Twitter, @StockTwits or Follow By Email. 
Just submit your email address in the box on the Blog homepage
This has been posted for Educational Purposes Only.   Do your own work and consult with Professionals before making any investment decisions.  
Past performance is not indicative of future results

Thursday, November 5, 2015

chart: SPY

Courtesy of TradeStation
White circled areas indicate the confirmation of the sell signal.  The indicators staying below zero was also a negative.  Yellow circled areas indicate the confirmation of the buy signal.
Green circles indicate areas for another possible change in trend.

Keep following JustSignals using Twitter, @StockTwits or Follow By Email. 
Just submit your email address in the box on the Blog homepage
This has been posted for Educational Purposes Only.   Do your own work and consult with Professionals before making any investment decisions.  
Past performance is not indicative of future results
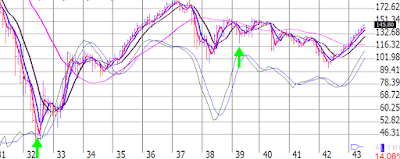
chart: Gap in FB

Courtesy of TradeStation
As of 11:20am EST the stock of FB had a gap opening on large volume.   Currently it is trading close to the opening price with a long wick up (shooting star candle).  If it closes near here, it could be somewhat bearish.  The gap on large volume can be either a runaway gap or an exhaustion gap.  With sentiment in the greed area and the AAII bears lower than 20 this week, it could be an exhaustion gap.

Keep following JustSignals using Twitter, @StockTwits or Follow By Email. 
Just submit your email address in the box on the Blog homepage
This has been posted for Educational Purposes Only.   Do your own work and consult with Professionals before making any investment decisions.  
Past performance is not indicative of future results

Short Term Update

The following was posted on October 22,2015
Today's comments are in Blue

Short term details:(every date is +/-)
Oct 26 high   In the posting made earlier on Oct 22nd the Oct 26 high was changed to Oct 23rd to Oct 26th+/-.    A high was made on Oct 23rd
 
Oct 30th low    As the market was rising it did make a low on Oct 30th
 
Nov 2nd high     A high was made on Nov 3rd.  (note the dates are +/-)
 
Nov 4-6 some kind of consolidation or a bias up into Nov 6     We are still in the Nov 4-6 window, but, it does look like we had a classic turn around day this morning.  The market drifted higher to DJIA + 42 and is currently DJIA -76.
 
Nov 9th low
Nov 12th high
Nov 17th low
 
More as we get through some of these dates...
 
Keep following JustSignals using Twitter, @StockTwits or Follow By Email. 
Just submit your email address in the box on the Blog homepage
This has been posted for Educational Purposes Only.   Do your own work and consult with Professionals before making any investment decisions.  
Past performance is not indicative of future results

Wednesday, November 4, 2015

charts: Testing the talked about "7 Year Cycle" Bottoms

NOTE that in the 20th century the "5th" year of the decade was a strong year.  In the early part of the 20th century this had been brought to light by the late WD Gann and an analysis of the decennial patterns throughout the century.  In addition, there are two 10 year cycle patterns.  One bottoms in years ending in a "2" and tops in a year ending in a "7" and the other bottoms in a year ending in a "4" and tops in a year ending in a "9".  This does not happen ALL the time, but it does happen often.  In fact you will see that when the "7 year cycle" falls on a year ending in a "5" that the bottom falls in the year before ending in a "4" probably because that cycle may be more dominant at the time.

Let's now see the "7 year cycles" going back to the early 1900's courtesy of Worden Bros. Charts.
A Green arrow notes the bottoms and since 1932 was a very dominant bottom the count back and forward use that year as a starting point.


Each time the "7 year cycle" bottomed the strength varied.  It was not the dominant cycle each time, but, there were many times it was and it made a meaningful bottom.
Will this cycle continue and make a bottom in 2016?  This cycle is now being watched by many many people.  The market will not make it easy for this cycle to bottom.  It is probable that head fake may be seen along the way.  Be prepared and be careful.

Keep following JustSignals using Twitter, @StockTwits or Follow By Email. 
Just submit your email address in the box on the Blog homepage
This has been posted for Educational Purposes Only.   Do your own work and consult with Professionals before making any investment decisions.  
Past performance is not indicative of future results


charts: Fear Greed Index

Courtesy of CNN/Money
Keep following JustSignals using Twitter, @StockTwits or Follow By Email. 
Just submit your email address in the box on the Blog homepage
This has been posted for Educational Purposes Only.   Do your own work and consult with Professionals before making any investment decisions.  
Past performance is not indicative of future results

Tuesday, November 3, 2015

Stan Druckenmiller interview

charts: DJIA

Courtesy of eSignal
As shown in a prior post, the monthly and weekly charts are on a sell signal.  Will the daily chart join in?  In the chart above, the DJIA broke above the rising wedge and now resistance has become support.
Courtesy of ChaikinAnalytics.com
The DIA price is rising without the OB/OS indicator and the CMF is not rising anymore with price.  Also the relative strength has been weak during this rally as shown in the circled area in Oct 2015.  Similar weak relative strength in the past were circled as well.
Courtesy of eSignal
The DJIA is the strongest index today, +0.49%.  The daily charts of each are indicative of today's price action.

Keep following JustSignals using Twitter, @StockTwits or Follow By Email. 
Just submit your email address in the box on the Blog homepage
This has been posted for Educational Purposes Only.   Do your own work and consult with Professionals before making any investment decisions.  
Past performance is not indicative of future results


Monday, November 2, 2015

chart: SPX MACD highest since 2000 top

Courtesy of @NorthmanTrader

November 2, 2015
$SPX MACD divergence over 30, a level not seen since the 2000 top.

For the full article and charts go to
http://northmantrader.com/technical-charts/

Keep following JustSignals using Twitter, @StockTwits or Follow By Email. 
Just submit your email address in the box on the Blog homepage
This has been posted for Educational Purposes Only.   Do your own work and consult with Professionals before making any investment decisions.  
Past performance is not indicative of future results

chart: Fear Greed Index

Courtesy of CNN?Money
Keep following JustSignals using Twitter, @StockTwits or Follow By Email. 
Just submit your email address in the box on the Blog homepage
This has been posted for Educational Purposes Only.   Do your own work and consult with Professionals before making any investment decisions.  
Past performance is not indicative of future results

chart: SPX Symmetry

Courtesy of @NorthmanTrader

For the full article go to this link:
http://northmantrader.com/2015/11/01/symmetry/

Keep following JustSignals using Twitter, @StockTwits or Follow By Email. 
Just submit your email address in the box on the Blog homepage
This has been posted for Educational Purposes Only.   Do your own work and consult with Professionals before making any investment decisions.  
Past performance is not indicative of future results